 icon to create.
View creating and linkage display |
DataInsights supports visualizing spatial data on map, creating thematic maps, creating charts by one-click and supports mouse drag operations. Maps include Classic, Unique, Range, Symbol Size and Heatmap; charts include Histogram, Bar chat, Bar graph, Pie chart, Line chart, Tree chart, Radar chart, Word cloud, Scatter chart, Box chart, Heat chart and Relation graph. Text view and Image view are also supported.
Once the data is added, the system automatically recognizes the field type, which is uniformly categorized into location, numerical value, text and date fields. Each of that can be used to create two views: maps and charts. Multiple views can be created and overlapped. For example, you can overlap a business chart on a map. And each view size can be adjusted by dragging in eight directions. For the overlapped views, the display order of each view can be changed. Additionally, Multiple maps and charts created based on the same data are linked by default.
Two ways are supported for creating maps:
icon to create.Once the map is created, you can do the following actions with the created map:
Similar to maps, creating charts support two ways:
 icon to create a chart.
Once the chart is created, you can do the following actions with the created chart:
In the upper navigation bar, select "Add Views >Text" to create a text view for adding a title or description for your insight item.
In the upper navigation bar, select "Add Views >Image" to create an image view, then upload local picture to the image view to create a richer visual insight project or use it as an auxiliary display for analysis reports.
View linkage is offered for discovering the association between spatial data and attribute data. Only the maps and charts created based on the same data can be displayed in association. Linkage display is opened by default. You can open/close in the View Setting at the upper right bar.
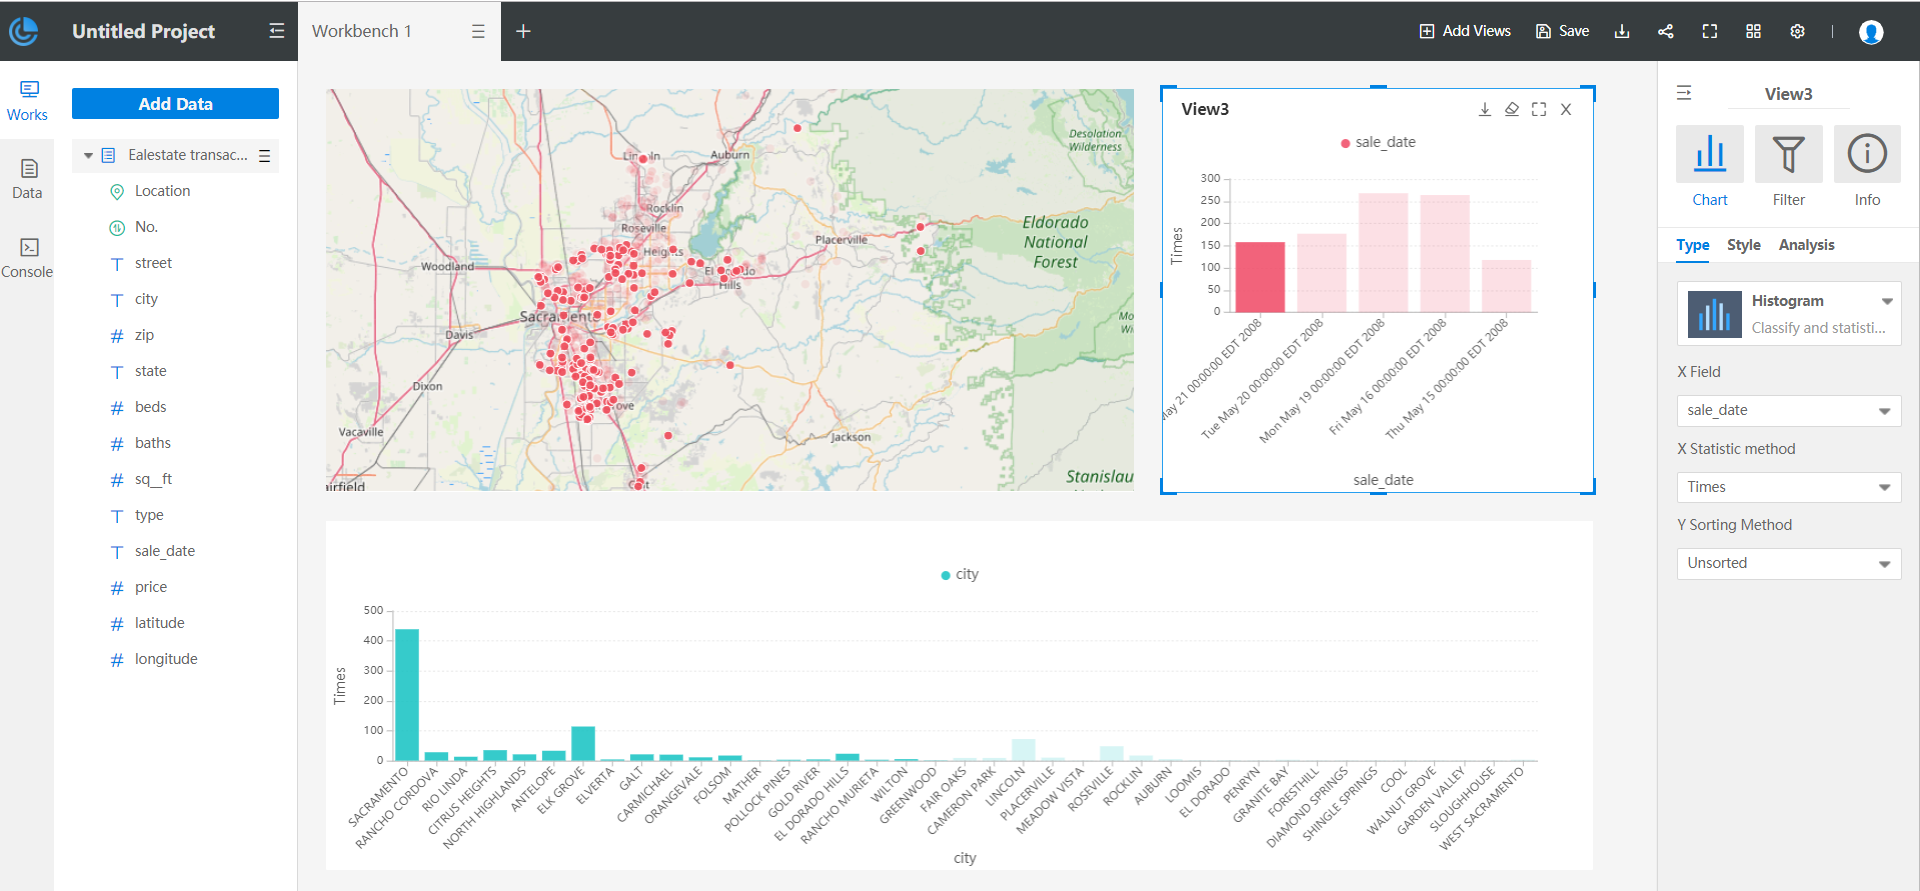
Specific operation: Select the data displayed on map or chart, the associated data on other map or chart will be highlighted. As shown in the figure below, on the right histogram click the first column, ie., the date is "May 21 00:00:00 EDT 2008", then all the house properties sold on this day are filtered and highlighted on the left map, and you can also have a glance at which cities in CA state have transactions on this day.
To clear the highlights, select any of linkage views, click "Clear Highlight" on the upper right of the view. After clearing, you can re-select the linkage data.